Terminal Benchmarking
As the number of "GPU-accelerated" terminal emulators continues to grow, I decided to download a few and run them through a benchmarking utility. Don't take these results to seriously; I spent a minute searching the web for a terminal benchmarking utility and loaded the first one I found.
The terminal emulators I tried are:
- Terminal.app
- iTerm2
- Kitty
- Alacritty
- Tabby
- Hyper
- Visual Studio Code
When you run termbench in a terminal emulator, it writes a ton of characters
to the terminal and measures the response rates. I didn't read much more about
it, so I don't truly know what these numbers mean. Are the number of seconds for
each category better when they're higher or lower? Are the speeds better when
they're larger? What are these categories anyway? Observating the "fastness" of
each terminal running termbench_release_clang, I am going to assume that
higher speeds and lower times mean a faster terminal.
The project README states:
On modern Windows machines with memory bandwidth in the 10-20gb/s range, the expected throughput for these tests would be in the 0.5-2.0gb/s range for a reasonable terminal. Numbers significantly higher than that might indicate a well-optimized terminal, and numbers significantly lower than that might indicate a poorly written terminal.
So I compiled termbench_release_clang and ran it once in each terminal
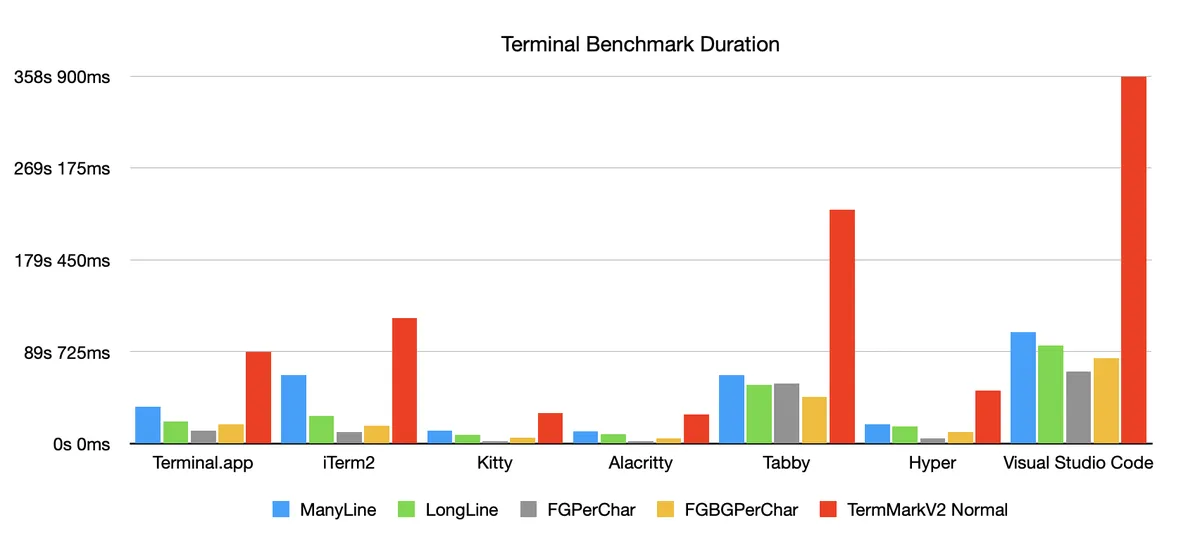
emulator. Here are the raw results:
Terminal.app
CPU: Apple M3 8 Core Processor (HP:4 LP:4)
VT support: no
ManyLine: 35.9505s (0.0278gb/s)
LongLine: 21.7549s (0.0460gb/s)
FGPerChar: 12.6217s (0.0230gb/s)
FGBGPerChar: 19.0376s (0.0296gb/s)
TermMarkV2 Normal: 89.3648s (0.0319gb/s)
iTerm2
CPU: Apple M3 8 Core Processor (HP:4 LP:4)
VT support: no
ManyLine: 67.0377s (0.0149gb/s)
LongLine: 26.8234s (0.0373gb/s)
FGPerChar: 11.4498s (0.0254gb/s)
FGBGPerChar: 17.2474s (0.0327gb/s)
TermMarkV2 Normal: 122.5584s (0.0233gb/s)
Kitty
CPU: Apple M3 8 Core Processor (HP:4 LP:4)
VT support: no
ManyLine: 13.0050s (0.0769gb/s)
LongLine: 8.6133s (0.1161gb/s)
FGPerChar: 2.5826s (0.1124gb/s)
FGBGPerChar: 5.6722s (0.0994gb/s)
TermMarkV2 Normal: 29.8731s (0.0955gb/s)
Alacritty
CPU: Apple M3 8 Core Processor (HP:4 LP:4)
VT support: no
ManyLine: 11.8043s (0.0847gb/s)
LongLine: 9.1261s (0.1096gb/s)
FGPerChar: 2.2228s (0.1306gb/s)
FGBGPerChar: 5.3773s (0.1049gb/s)
TermMarkV2 Normal: 28.5305s (0.1000gb/s)
Tabby
CPU: Apple M3 8 Core Processor (HP:4 LP:4)
VT support: no
ManyLine: 67.0478s (0.0149gb/s)
LongLine: 57.1490s (0.0175gb/s)
FGPerChar: 58.9302s (0.0049gb/s)
FGBGPerChar: 45.5744s (0.0124gb/s)
TermMarkV2 Normal: 228.7014s (0.0125gb/s)
Hyper
CPU: Apple M3 8 Core Processor (HP:4 LP:4)
VT support: no
ManyLine: 18.7012s (0.0535gb/s)
LongLine: 16.95065 (0.0590gb/s)
FGPerChar: 5.1101s (0.0568gb/s)
FGBGPerChar: 11.1717s (0.0505gb/s)
TermMarkV2 Normal: 51.93365 (0.0550gb/s)
Visual Studio Code
CPU: Apple M3 8 Core Processor (HP:4 LP:4)
VT support: no
ManyLine: 109.0999s (0.0092gb/s)
LongLine: 96.1632s (0.0104gb/s)
FGPerChar: 70.3354s (0.0041gb/s)
FGBGPerChar: 83.2457s (0.0068gb/s)
TermMarkV2 Normal: 358.84425_(0.0080gb/s)
And everyone loves a chart, so here is one.
Some interesting observations during this test.
- The emulators written in TypeScript all froze after running the test. In order to copy the results from the test, I had to take a screenshot of the terminal and extract the text using OCR.
- Clearly the Rust terminal emulators that claim to be speedy are in fact speedy. If you value terminal emulator performance highly, you'd do well to use Alacritty or Kitty or another compiled terminal emulator.
- I was surprised that Terminal.app performed better than iTerm2.
- I was not suprised at all that Visual Studio Code's terminal emulator was the worst performer.
- I was surprised at how well Hyper performed, considering it is an Electron & TypeScript application.
If you want an overall best terminal emulator rating, the "TermMarkV2 Normal" rating is the overall test runtime. Using that number as our measurement of success, that puts our ranking as follows:
- Alacritty (28s)
- Kitty (29s)
- Hyper (51s)
- Terminal.app (89s)
- iTerm2 (122s)
- Tabby (228s)
- Visual Studio Code (358s)